
Satellites Reveal Massive Ice Loss From Greenland and Antarctica
Earth has lost an extraordinary amount of frozen water from its two largest ice sheets over the past several decades. New satellite-based research shows that ice loss from Greenland and Antarctica has reached trillions of tons, providing scientists with one of the clearest long-term pictures yet of how the polar regions are changing.
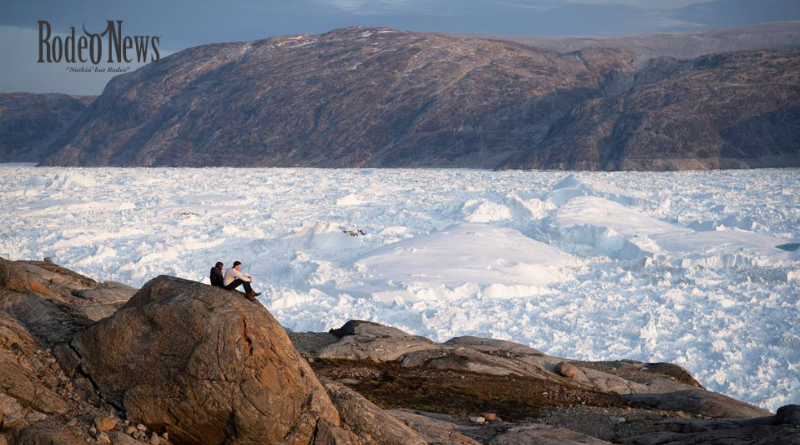
According to an Associated Press report published by KSL, about 12.5 trillion tons of ice have been lost from Greenland and Antarctica since 1979. The amount is so large that, if spread across the continental United States, it would form a layer of ice roughly 5 feet deep.
The underlying international research effort, however, gives a slightly different figure for the specific 1979–2023 period. The European Space Agency says the combined ice sheets lost 11.3 trillion tonnes during those years, contributing approximately 3.14 centimeters to global sea-level rise.
Despite the difference in presentation, the long-term message is consistent: Greenland and Antarctica are losing ice, and the rate of loss has accelerated compared with earlier decades.
Ice Loss Accelerated After the 1990s
The new satellite record allows scientists to look much farther back than many previous assessments.
The research was assembled by the Ice Sheet Mass Balance Intercomparison Exercise, or IMBIE, an international collaboration supported by NASA and ESA. Scientists combined observations from dozens of satellite missions to build a longer and more consistent record of changes across Greenland and Antarctica.
ESA says the record reaches back to 1972 for Greenland and 1979 for Antarctica.
That longer perspective is important because the changes were not constant throughout the entire period.
During the 1970s and 1980s, the ice sheets were comparatively close to balance. Ice accumulation from snowfall was more capable of offsetting losses.
The situation changed substantially during the 1990s.
Ice loss accelerated, and the rate increased further during the 2010s. ESA reports that Greenland’s annual ice loss increased from roughly 60 billion tonnes per year in the 1980s to 264 billion tonnes per year in the 2010s.
Antarctica followed a similar pattern. Its annual losses increased from approximately 48 billion tonnes per year in the 1980s to 202 billion tonnes per year during the 2010s.
These figures illustrate why researchers emphasize the importance of examining the trend over decades rather than focusing on a single year’s measurements.
Most Ice Loss Is Happening Through Faster-Moving Glaciers
One of the most important findings concerns how the ice is being lost.
It might be easy to imagine that the enormous losses are primarily caused by ice melting at the surface under warmer air. But the satellite observations show that the majority of the loss has another mechanism.
According to ESA, approximately 84% of the combined ice loss between 1979 and 2023 resulted from glaciers accelerating and sending more ice into the ocean. Only about 16% was caused by surface melting.
This process is known as dynamic ice loss.
Large glaciers act as pipelines carrying ice from the interior of an ice sheet toward the ocean. When these glaciers accelerate, they can discharge enormous quantities of ice into the sea.
Ocean temperatures also matter.
Warmer ocean water can attack glaciers and floating ice shelves from below. As ice shelves thin or weaken, they can provide less resistance to the glaciers behind them, allowing more land-based ice to flow toward the ocean.
That distinction is particularly important for understanding Antarctica.
NASA observations have previously shown that warmer ocean waters play a major role in modern Antarctic ice loss, particularly around vulnerable areas of West Antarctica.
Greenland Is Losing Ice Rapidly
Greenland has experienced significant ice loss in recent decades.
NASA’s satellite observations show that Greenland has been losing hundreds of billions of metric tons of ice annually. NASA estimates an average loss of approximately 264 billion tons per year between 2002 and 2025 in its latest Greenland mass-loss visualization.
The Greenland Ice Sheet is especially important because it contains an enormous quantity of frozen freshwater.
As Greenland loses land-based ice, meltwater and ice discharged into the ocean contribute directly to rising sea levels.
Glacier retreat is also becoming increasingly visible in Greenland.
The Jakobshavn Glacier, one of the island’s best-known glaciers, has experienced extremely rapid movement and retreat. The AP report cited scientists who said the glacier can retreat by as much as 164 feet per day under certain conditions.
Such short-term measurements should not be interpreted as a constant daily rate for the entire ice sheet. Instead, they demonstrate how rapidly individual outlet glaciers can change.
Antarctica Presents a Different Challenge
Antarctica is far larger than Greenland and behaves differently.
The continent contains enormous amounts of ice, much of it sitting above or near sea level. Changes in snowfall, ocean temperatures, glacier flow and ice-shelf stability all influence its overall mass balance.
NASA estimates that Antarctica has lost ice at an average rate of roughly 135 billion metric tons per year since 2002, based on GRACE and GRACE Follow-On satellite observations.
The largest losses have been concentrated in vulnerable areas, particularly West Antarctica.
Pine Island Glacier and Thwaites Glacier are among the areas scientists closely monitor because their ice flow has accelerated and their surrounding environment is strongly influenced by the ocean.
At the same time, Antarctica can experience periods when increased snowfall temporarily offsets some ice losses.
That happened during part of the 2020–2023 period.
ESA reports that unusually high snowfall over East Antarctica added enough ice to partially compensate for losses elsewhere. Scientists caution that this did not represent a reversal of the longer-term trend.
A Temporary Pause Does Not Mean the Trend Reversed
The satellite record contains fluctuations.
Between 2020 and 2023, overall ice loss slowed compared with the preceding period. Greenland experienced relatively mild summers, reducing surface melting, while increased snowfall in East Antarctica temporarily boosted the continent’s ice mass.
However, researchers describe these changes as short-term variations rather than evidence that the long-term decline has ended.
This distinction is important when interpreting climate data.
Weather can change from year to year. Snowfall can increase temporarily. Summer temperatures can vary. Atmospheric circulation can also influence individual regions.
Long-term climate trends are identified by looking at much longer periods.
The new satellite record does exactly that.
By combining measurements from 27 satellite missions and dozens of independent surveys, scientists were able to identify a persistent pattern extending across several decades.
Ice Loss Is Raising Global Sea Levels
The most direct consequence of losing land-based ice is its contribution to sea-level rise.
ESA estimates that Greenland and Antarctica together contributed approximately 3.14 centimeters of global sea-level rise between 1979 and 2023. Greenland accounted for about 1.81 centimeters, while Antarctica contributed roughly 1.33 centimeters.
That number may appear relatively small when expressed in centimeters.
But even small increases in global average sea level can have significant consequences for coastal communities because higher baseline water levels make flooding easier during storms, high tides and extreme weather events.
The AP report cited scientists who estimated that every additional centimeter of sea-level rise could expose another 2 million to 3 million people to flooding at least once a year.
Sea-level rise is also not caused solely by Greenland and Antarctica.
Warming seawater expands, and mountain glaciers and other land-based ice sources also contribute to rising ocean levels.
However, the major polar ice sheets are especially important because of their enormous size and their potential to influence sea levels over much longer time periods.
Why Satellite Monitoring Matters
Scientists could not build this long-term picture without satellites.
The polar regions are vast, remote and difficult to measure continuously from the ground. Satellite missions provide repeated observations of ice elevation, gravitational changes, glacier movement and other indicators.
NASA’s GRACE and GRACE Follow-On missions, for example, measure changes in Earth’s gravity field associated with changes in the distribution of mass. These measurements allow scientists to estimate how much ice Greenland and Antarctica are gaining or losing.
Other satellites measure changes in ice height and surface characteristics.
ESA’s CryoSat mission is one example. Combined with other satellite missions, it helps scientists construct a longer record of polar ice-sheet changes.
The strength of the new assessment comes partly from combining different techniques.
Instead of depending on a single satellite or measurement method, researchers compared multiple independent observations.
New York University ice scientist David Holland, who was not involved in the study, told AP that the use of relatively independent methods increased his confidence in the findings.
What the Findings Mean for the Future
The research does not provide a simple timetable for future sea-level rise.
Ice sheets are complicated systems. Their response depends on atmospheric temperatures, ocean conditions, snowfall, glacier dynamics, ice-shelf stability and other factors.
But the longer satellite record gives scientists a better basis for understanding how those systems are changing.
ESA notes that the response of Greenland and Antarctica represents one of the largest uncertainties in future sea-level projections. The potential for changes in ice-sheet stability is especially important when scientists consider longer-term scenarios.
The researchers also emphasize that changes can continue even after atmospheric warming slows.
Ice sheets respond over long timescales. A glacier that has accelerated may continue flowing rapidly, while ocean waters interacting with an ice shelf can influence the system over many years.
That means today’s observations provide information not only about current conditions but also about processes that could shape future sea levels.
The 12.5 Trillion-Ton Figure in Perspective
The headline figure of 12.5 trillion tons of ice is difficult to visualize.
The AP report compares the amount with a hypothetical layer of ice roughly 5 feet deep covering the continental United States. It represents an enormous transfer of frozen freshwater from land into the ocean.
At the same time, the figure should be interpreted carefully.
The underlying IMBIE assessment cited by ESA calculates 11.3 trillion tonnes between 1979 and 2023, with a corresponding 3.14-centimeter contribution to global sea-level rise.
The difference does not undermine the broader finding. It highlights why readers should pay attention to the exact measurement period and methodology when comparing figures from different reports.
Scientists regularly update estimates as new satellite observations become available and measurement techniques improve.
What Scientists Will Watch Next
Researchers will continue monitoring several key indicators.
One is the speed at which outlet glaciers move toward the ocean. Another is the amount of ice being lost from glacier fronts and ice shelves.
Ocean temperatures near Antarctica are also critical.
In Greenland, scientists are closely watching both surface melting and the behavior of major outlet glaciers.
Snowfall is another important variable because increased accumulation can temporarily offset some losses.
NASA’s long-running observations show that both major ice sheets have experienced sustained mass loss in the satellite era.
The value of the new record is that it places recent changes into a much longer historical context.
Instead of seeing individual years as isolated events, scientists can now compare decades of measurements and identify persistent changes.
The Bigger Picture
The latest satellite research provides a detailed look at one of the most consequential changes occurring in Earth’s polar regions.
Greenland and Antarctica are not simply experiencing occasional episodes of melting. Their combined ice mass has declined over decades, and the rate of loss increased substantially after the 1990s.
Much of that loss is connected to faster-flowing glaciers sending ice into the ocean, while surface melting and snowfall continue to influence the year-to-year balance.
The temporary slowdown observed between 2020 and 2023 demonstrates why individual years can be misleading. Longer records reveal the broader pattern.
Satellite observations will therefore remain essential.
As new missions collect more data, scientists will be able to determine whether the acceleration continues, how individual glaciers respond to changing ocean conditions, and how polar ice loss affects future sea levels.
For now, the evidence from decades of satellite observations provides a clear measurement of the scale of change: trillions of tons of ice have disappeared from Greenland and Antarctica, and the loss has contributed measurably to rising seas.